
Bing AI Performance Report: How to Read Your Copilot Citations
A walkthrough of the AI Performance report in Bing Webmaster Tools, using six months of real data: what each metric means, how sampling skews it, and how to turn citations into a content plan.
Wyatt Johnson
November 5, 2026
In short
- 01 Bing's AI Performance report is the only free, first-party source that shows how often an AI assistant cites your pages. It covers Microsoft Copilot, Bing's AI summaries and select partners.
- 02 The data is sampled. On Zentrix.ai, 8,200 citations over six months surfaced only two grounding queries, and the most cited page showed no queries at all.
- 03 The Pages view and Compare are the most reliable parts of the report. Use them to find the pages AI already trusts and the ones gaining or losing ground month over month.
- 04 Citations are not clicks. Treat the report as a visibility signal and pair it with Search Console and GA4 for traffic.
Bing Webmaster Tools has a report that Google does not offer: a count of how often an AI assistant cites your site. The AI Performance report shows how many times your pages were referenced in Microsoft Copilot, Bing’s AI-generated summaries and select partner AI products, which pages were cited and which phrases pulled them in.
This guide walks through every part of the report using a live property. With their permission, we used six months of data from Zentrix.ai, a stock research client, so every screenshot and number below is real. We pulled it in November 2026.
What you need
- A site verified in Bing Webmaster Tools (free)
- Enough AI citation activity to register. Very small or new sites may see little or nothing at first
- About 30 minutes for the first read, then 15 minutes a month
What the report counts
Get the definitions straight before looking at any chart. Microsoft’s help page defines them, and they are narrower than most people assume.
| Metric | What it means |
|---|---|
| Total citations | How many times your content was visibly shown as a source in an AI answer during the date range |
| Cited pages | Unique pages from your site cited on a given day |
| Avg. cited pages | The daily average of cited pages across the date range |
| Grounding query | A short, grouped phrase the AI used when retrieving your content. Not the user’s actual prompt |
| Intent | An AI-assigned label for the grounding query, such as Informational, Research, Navigational or Comparison |
| Topic | An AI-assigned theme that groups related grounding queries |
| Citation share | Your share of all citations shown for that grounding query, as a percentage |
Two things the report does not measure: clicks and rankings. A citation means your page appeared as a source. It says nothing about whether anyone clicked it.
Step 1: Verify your site
If your site is already in Bing Webmaster Tools, skip ahead. If not, sign in at bing.com/webmasters and add it. The fastest route is Import from Google Search Console, which brings over your verified properties in one step. Otherwise, verify with a DNS record, a meta tag or an XML file, the same as Search Console.
While you are there, submit your sitemap under Sitemaps and turn on IndexNow if your platform supports it. AI Performance only reflects content Bing can index, so crawl coverage comes first.
Step 2: Open the report and set a date range
Select AI Performance in the left menu. It still carries a Beta tag. The top of the page has two totals, a daily chart and date range buttons: 7 D, 30 D, 3 M, 6 M, Custom and Compare.
Start with 6 M to see the longest history available.
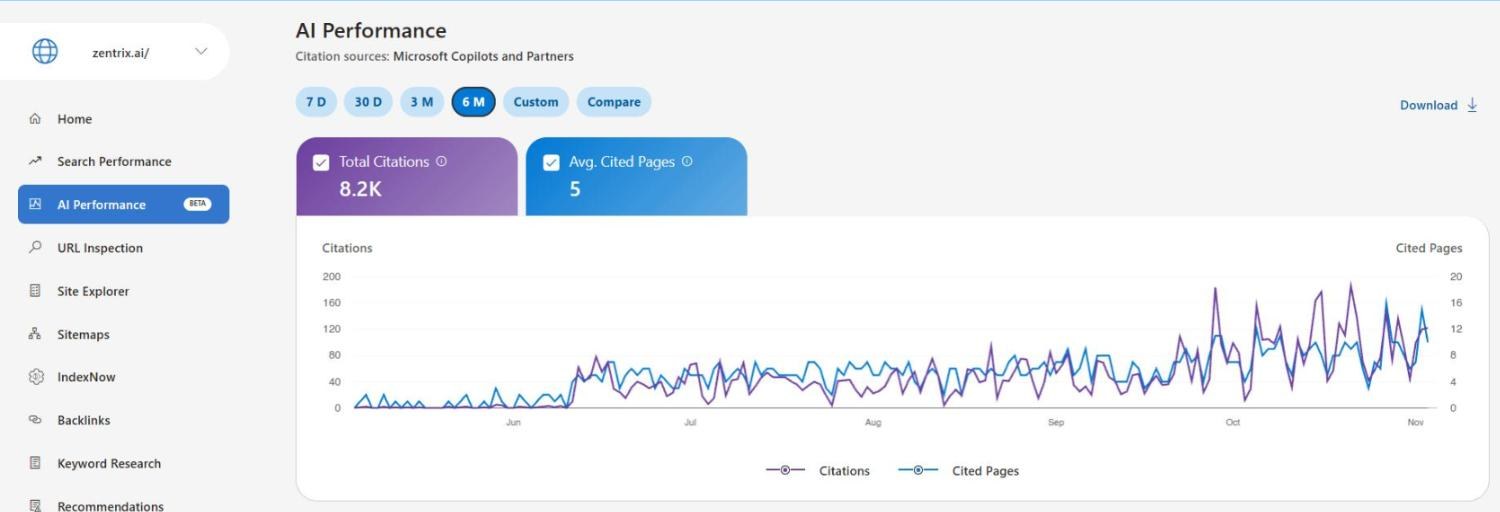
Here is how to read Zentrix’s chart:
- May to mid-June: almost nothing. Zero to five citations a day.
- 12 June: a step change. Citations jumped from 10 to 62 in a day and held at 40 to 80 a day from then on. That is the shape of a reporting change, not a content win. Microsoft was rolling out new AI Performance features that month, and other site owners reported similar jumps around the same time.
- Late September onward: real growth. Peaks of 150 to 186 a day, and average cited pages roughly doubling from 5 to 10.
The lesson: if your chart has a cliff in early or mid-June, do not compare anything to the weeks before it. Set your baseline after the step.
Microsoft is explicit that the trend line is observational. A rise can come from your content, from more people asking about your topic or from a model update, and the report cannot tell you which.
Step 3: Read the grounding queries
Scroll down to List By and select Grounding Queries. Each row shows the phrase, its intent and topic labels, your citation count and your citation share.
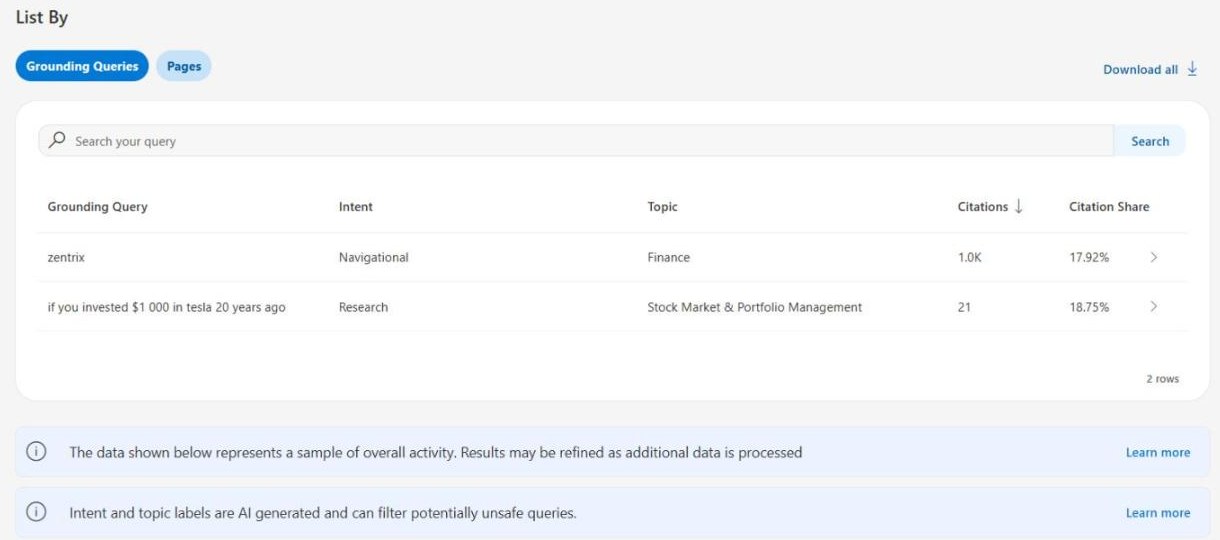
This is where most people get confused. Zentrix had 8,200 citations over six months, and the table shows two grounding queries, accounting for about 1,020 of them. The other 7,000 or so citations have no visible query.
That is sampling, not a bug. Microsoft’s documentation says the report is “a sample of overall citation activity” and that “very low or infrequent citation activity may not surface.” Grounding queries are also grouped into short phrases, so the long, specific prompts people type into Copilot get rolled up or dropped.
What you can still take from this table:
- Branded queries show up first. “zentrix” is the top row. It tells you Copilot uses your site to answer questions about your own brand, which is the baseline you want.
- Citation share is the useful number. Zentrix gets 17.92% of citations shown for “zentrix”. In other words, more than four out of five citations on a query for its own brand name point somewhere else, such as review sites, directories or social profiles. For a branded query, that is a gap worth closing.
- Non-branded rows are gold. “if you invested $1 000 in tesla 20 years ago” is a real research question that Zentrix’s Tesla calculator answers. Any non-branded row is direct evidence of which questions your content wins.
- Do not trust the labels too far. Bing tagged “zentrix” with the topic Finance and the Tesla query as Stock Market & Portfolio Management. Both labels are AI-generated and broad.
Citation share does not tell you who holds the rest. Bing deliberately hides competitor domains.
Step 4: Read the Pages view
Switch List By to Pages. This view is far more complete than the query list, because it does not depend on query sampling. Zentrix shows 55 cited pages over six months. The top of the list:
| Page | Citations (6 months) |
|---|---|
| /nvidia-stock-calculator/ | 2,000 |
| /tesla-stock-calculator/ | 1,500 |
| / (homepage) | 1,100 |
| /apple-stock-calculator/ | 1,100 |
| /walmart-stock-calculator/ | 715 |
| /sandisk-stock-calculator/ | 275 |
| /google-stock-calculator/ | 273 |
The pattern is obvious once you see it. Eight of the top ten pages are single-purpose calculators that answer one numeric question: what would an investment in this stock be worth today. AI assistants cite pages that hold a specific, checkable answer. Blog posts appear much further down, at around 25 citations each.
Run the same read on your own site. Group your cited pages by template (product page, guide, tool, blog post, homepage) and see which template wins. That tells you what kind of page to build more of.
Step 5: Connect queries to pages
Click the arrow at the end of any row to filter the whole report by it. Filtering by a query shows which pages it cited. Filtering by a page shows which queries cited it.
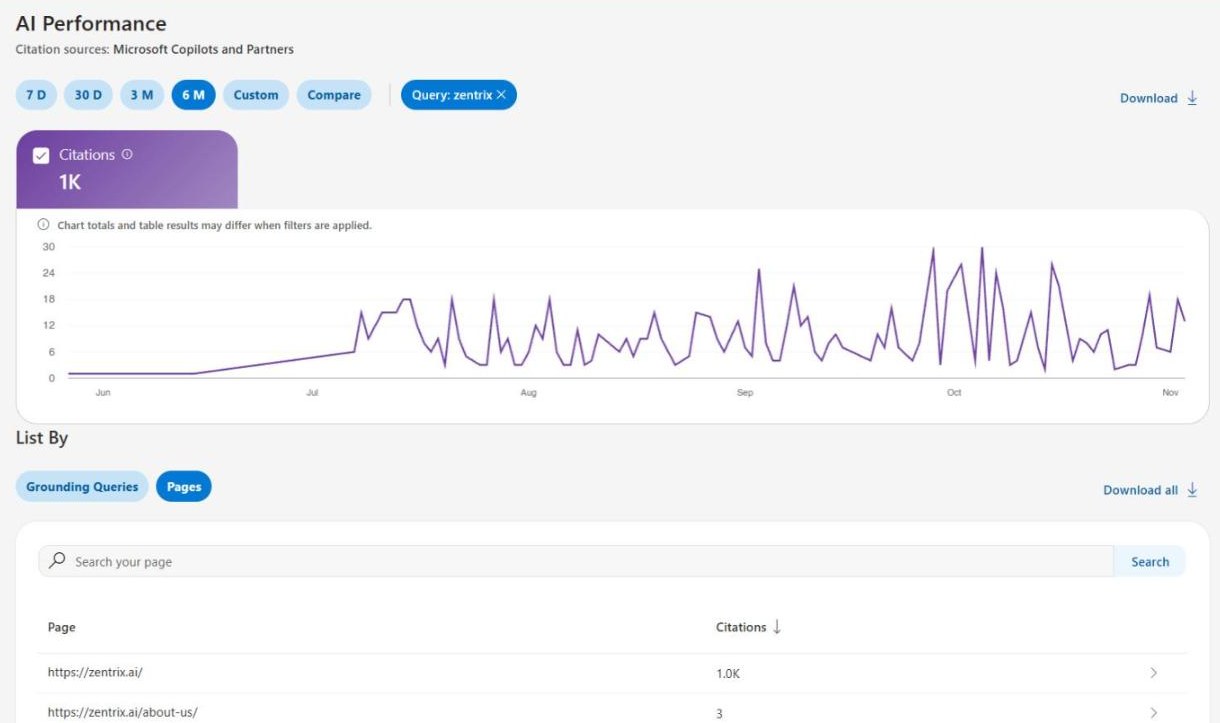
Here is the “zentrix” query filtered to pages. Nearly all of its 1,000 citations go to the homepage, with three to the About page.
Now the opposite direction. The Nvidia calculator is Zentrix’s most cited page, at 2,000 citations, but filtering by it returns No data available for grounding queries.
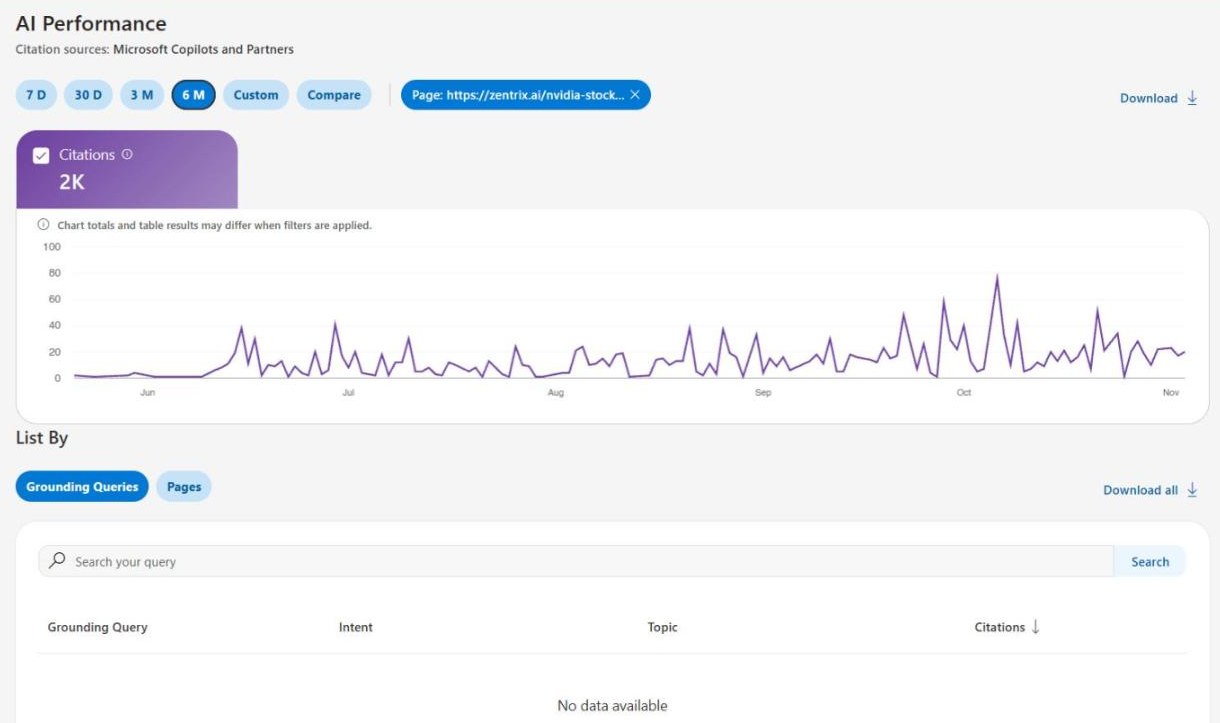
This is sampling again. The page is cited across many different prompts, and none of them individually clears Bing’s threshold to appear as a grouped phrase. Microsoft notes this “does not indicate a penalty or exclusion.”
Three rules for this view:
- You can filter by one query or one page, not both.
- Counts can differ depending on which way you filter, because queries and pages are sampled over slightly different windows. Do not try to make the numbers add up.
- The banner reads “Chart totals and table results may differ when filters are applied.” Believe it.
Step 6: Use Compare to see what moved
Compare is the most useful part of the report for ongoing work. Click it and choose last 7 days or last 30 days against the previous period, or set two custom ranges.
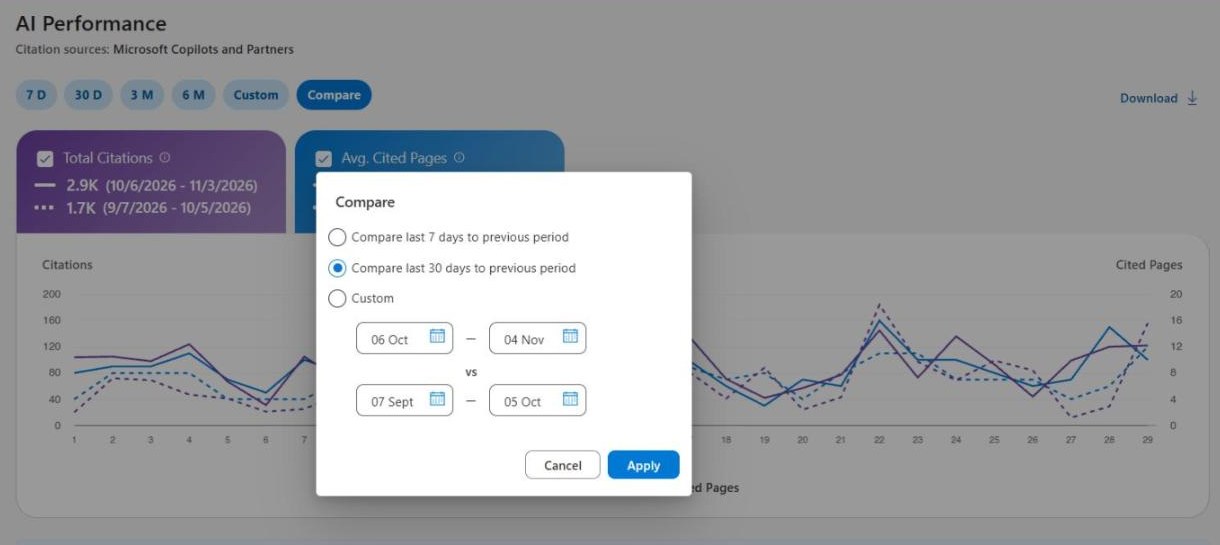
The chart overlays the two periods, with the current one as a solid line and the previous one dashed. For Zentrix, the last 30 days had 2,900 citations against 1,700 in the 30 days before, a 71% increase, and average cited pages went from 7 to 9.
The Pages table becomes a diff, with Last Citations, Prev Citations and Diff Citations columns:
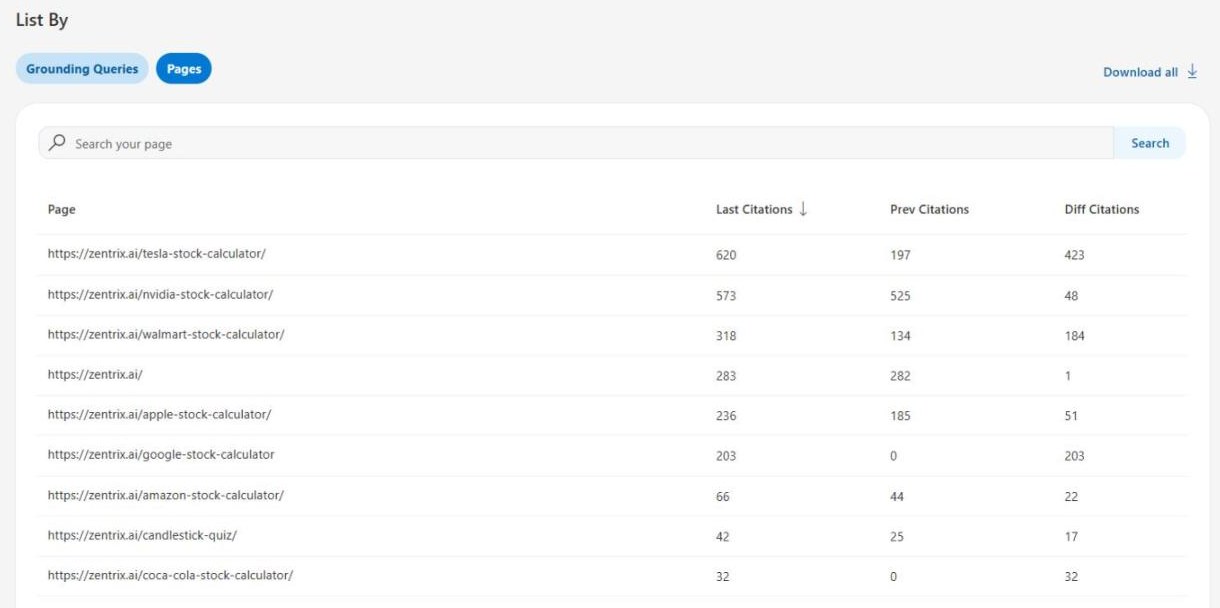
What to look for:
- Big positive diffs. The Tesla calculator gained 423 citations and Walmart gained 184. Find out what changed on those pages or in the news, and apply it elsewhere.
- Negative diffs. The SanDisk calculator dropped from 77 to 30. A falling page is the first place to refresh content, check facts and update dates.
- Pages that jump from zero. The Google calculator shows 203 citations against 0 previously. Look closely at the URL:
/google-stock-calculator, with no trailing slash. Over six months, the version with a trailing slash had 273 citations of its own. The same thing happened with the Coca-Cola calculator and with a blog post reachable at two different paths.
That last point is easy to miss and easy to fix. When the same page lives at two URLs, Bing splits its citations between them, and neither version looks as strong as it really is. Pick one URL format, 301 redirect the other, set a canonical tag and resubmit through IndexNow.
Step 7: Export the data
There are two export buttons. Download, at the top, exports the chart’s daily time series. Download all, above the table, exports the full grounding query or page list. Both come as CSV or Excel, and both respect any filter you have applied.
Export monthly and keep the files. Bing only shows the history it currently holds, and preview features change. A folder of monthly exports is the only way to track a year of AI visibility.
Step 8: Turn the report into a content plan
This is the part that matters. Each signal in the report points to a specific action:
| What you see | What to do |
|---|---|
| A page template that dominates citations (Zentrix: calculators) | Build more pages in that format for adjacent questions |
| A non-branded grounding query | Find the page it cites. Tighten the answer, add a table, keep the figures current |
| Low citation share on your brand name | Fix your About page, Organization schema and profiles on the sites AI cites for brand questions |
| A page with a negative diff | Refresh it: new data, a clear dated answer near the top, updated examples |
| The same page cited under two URLs | Redirect to one version, set a canonical tag, resubmit through IndexNow |
| Important pages missing from the Pages list | Check that Bing indexes them in URL Inspection, then improve structure and clarity |
Use Claude to read the export
The exports are small enough to hand straight to Claude. Download the Pages list for the last 30 days with Compare on, attach it to a conversation, and ask:
This is a Bing Webmaster Tools AI Performance export comparing the last 30 days
to the previous 30. Group the pages by template type based on the URL. For each
group, give total citations and the change. Then list:
1. The five pages with the biggest gains, and what they have in common.
2. Every page with a drop, ranked by size.
3. Any URLs that look like duplicates of each other (trailing slash, different
   folder, query strings).
Keep it to one page.
If you have the Search Console MCP server and the Google Analytics MCP server connected, ask Claude to check the same pages in both. You will see whether a page AI cites more often also earns more organic clicks and more referral sessions from Copilot.
Limits to keep in mind
- Microsoft only. The report covers Copilot, Bing’s AI summaries and select partners. It tells you nothing about ChatGPT, Gemini, Perplexity or Claude.
- No clicks. A citation is not a visit. Use GA4 to measure the referral traffic that follows.
- Sampled. Totals across the chart, the queries and the pages will not match. Use the report for trends and comparisons, not exact accounting.
- No competitors. Citation share shows how much of a query you hold, never who holds the rest.
- Still in preview. Intents, Topics, Citation Share and Compare launched in June 2026 and the labels are still improving. Expect the report to keep changing.
Even with those limits, it is the only free, first-party view of AI citations available today.
Where this goes next
The AI Performance report shows where you already win. The harder work is winning the questions you are missing, on Copilot and on every other assistant. That is what our GEO practice does: we track citations across platforms, find the pages and sources assistants trust in your category, and build the content and placements to get you cited.
For the content side, read how to structure blogs for LLM citations. For the measurement side, our Reporting Systems practice can pull Bing, Search Console and GA4 into one monthly report that Claude writes for you.